Methodology
The CPI Framework of Indicators
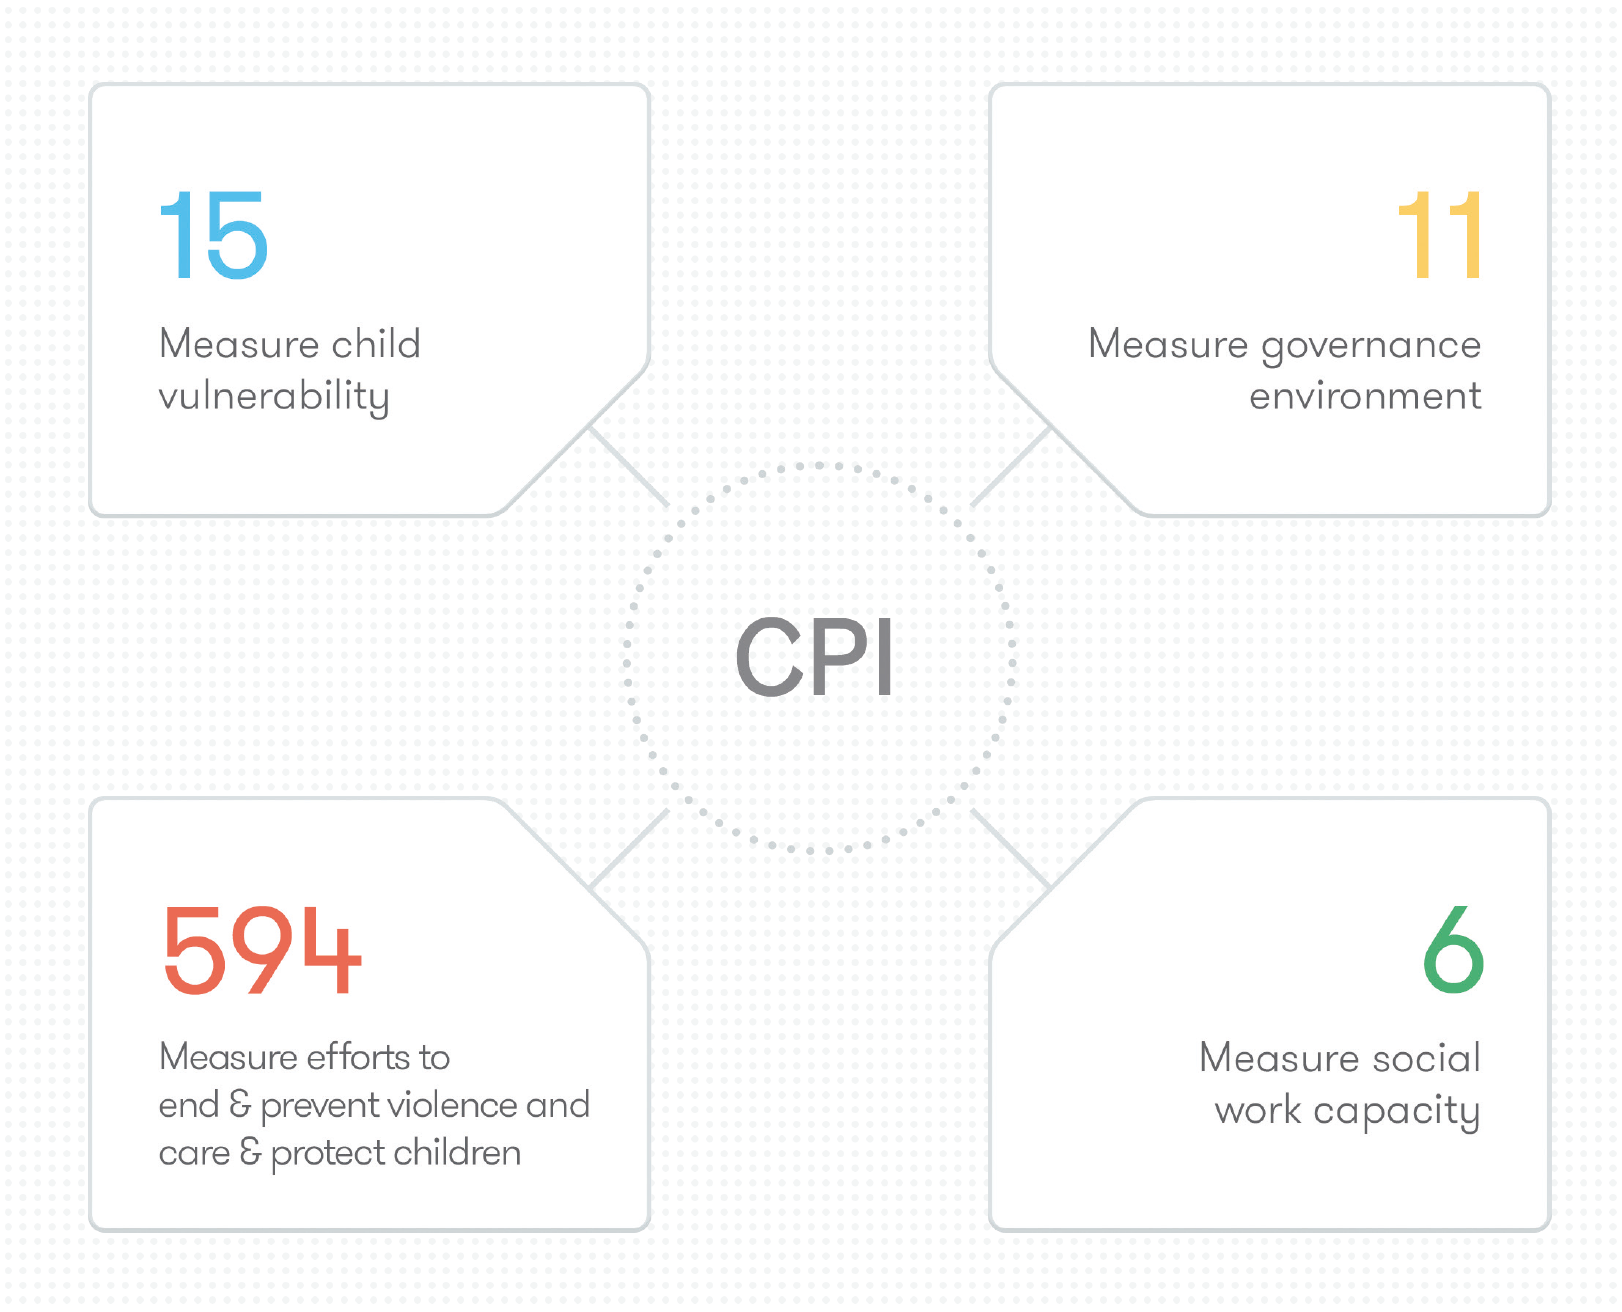
The Index framework includes a series of 626 indicators that together measure a state’s policy and actions towards greater child protection. The indicators are drawn from four sources.
The first set of indicators draws from quantitative data about the current child protection status of girls and boys in each country. For example, one indicator considers the rate of children aged 0–2 in residential care (per 100,000 population aged 0–2), at the end of the year. For a review of all quantitative indicators used, please see the endnotes.1 Data collected for this section originates directly from UNICEF’s TransMoEE database, a widely used source of data on the well-being of children globally and official statistical data reported by the five pilot countries.
The second set of indicators comes from Article 4 of the UNCRC. This Article requires that states apply all appropriate measures within the toolbox of government action to achieve child protection. The Index refers to this category as “the governance environment” for child protection. An example of the governance environment indicator is: Has a consolidated law on the rights of the child and child protection been adopted? Third, the Index uses specific child protection articles from the UNCRC and principles from the systems approach to child protection as the common foundation and matrix for its qualitative indicators.
To unpack each Article’s requirements, the Index framework heavily relies on the Implementation Handbook for the Convention on the Rights of the Child published by UNICEF. The Handbook offers analysis on each UNCRC Article from the Committee on the Rights of the Child’s Concluding Observations in over 300 different opinions. The Handbook provides a series of “yes”, “no” and “partially-implemented” checklists to create an understanding of each Article’s significance.
The Index uses these checklists as core indicators for the framework. The qualitative indicators are “yes”, “no” and “partially-implemented” questions that measure a state’s (i) Policy/ legal and regulatory framework; (ii) Services, processes, mechanisms; (iii) Capacity; (iv) Accountability; and (v) Coordination and cooperation in relation to the UNCRC articles on child protection. These key elements are necessary to achieve a functional child protection system.2
UNCRC articles chosen are those associated with every child’s right not to be subjected to harm. The articles together form adequate responses to prevent and respond to violence, abuse, exploitation and neglect experienced by girls and boys in all settings. The following UNCRC articles form the basis of the Index:
- Article 9 Separation from parents
- Article 19 Child’s right to protection from all forms of violence
- Article 20 Children deprived of their family environment
- Article 21 Adoption
- Article 23 Rights of children with disabilities
- Article 25 Periodic review of treatment (integrated with other articles, where relevant)
- Article 32 Child labour
- Article 33 Children and drug abuse
- Article 34 Sexual exploitation of children
- Article 35 Prevention of abduction, sale and trafficking
- Article 36 Protection from other forms of exploitation
- Article 38 Protection of children affected by armed conflict
- Article 39 Rehabilitation of child victims (integrated with other articles, where relevant)
Dimensions of Government Action
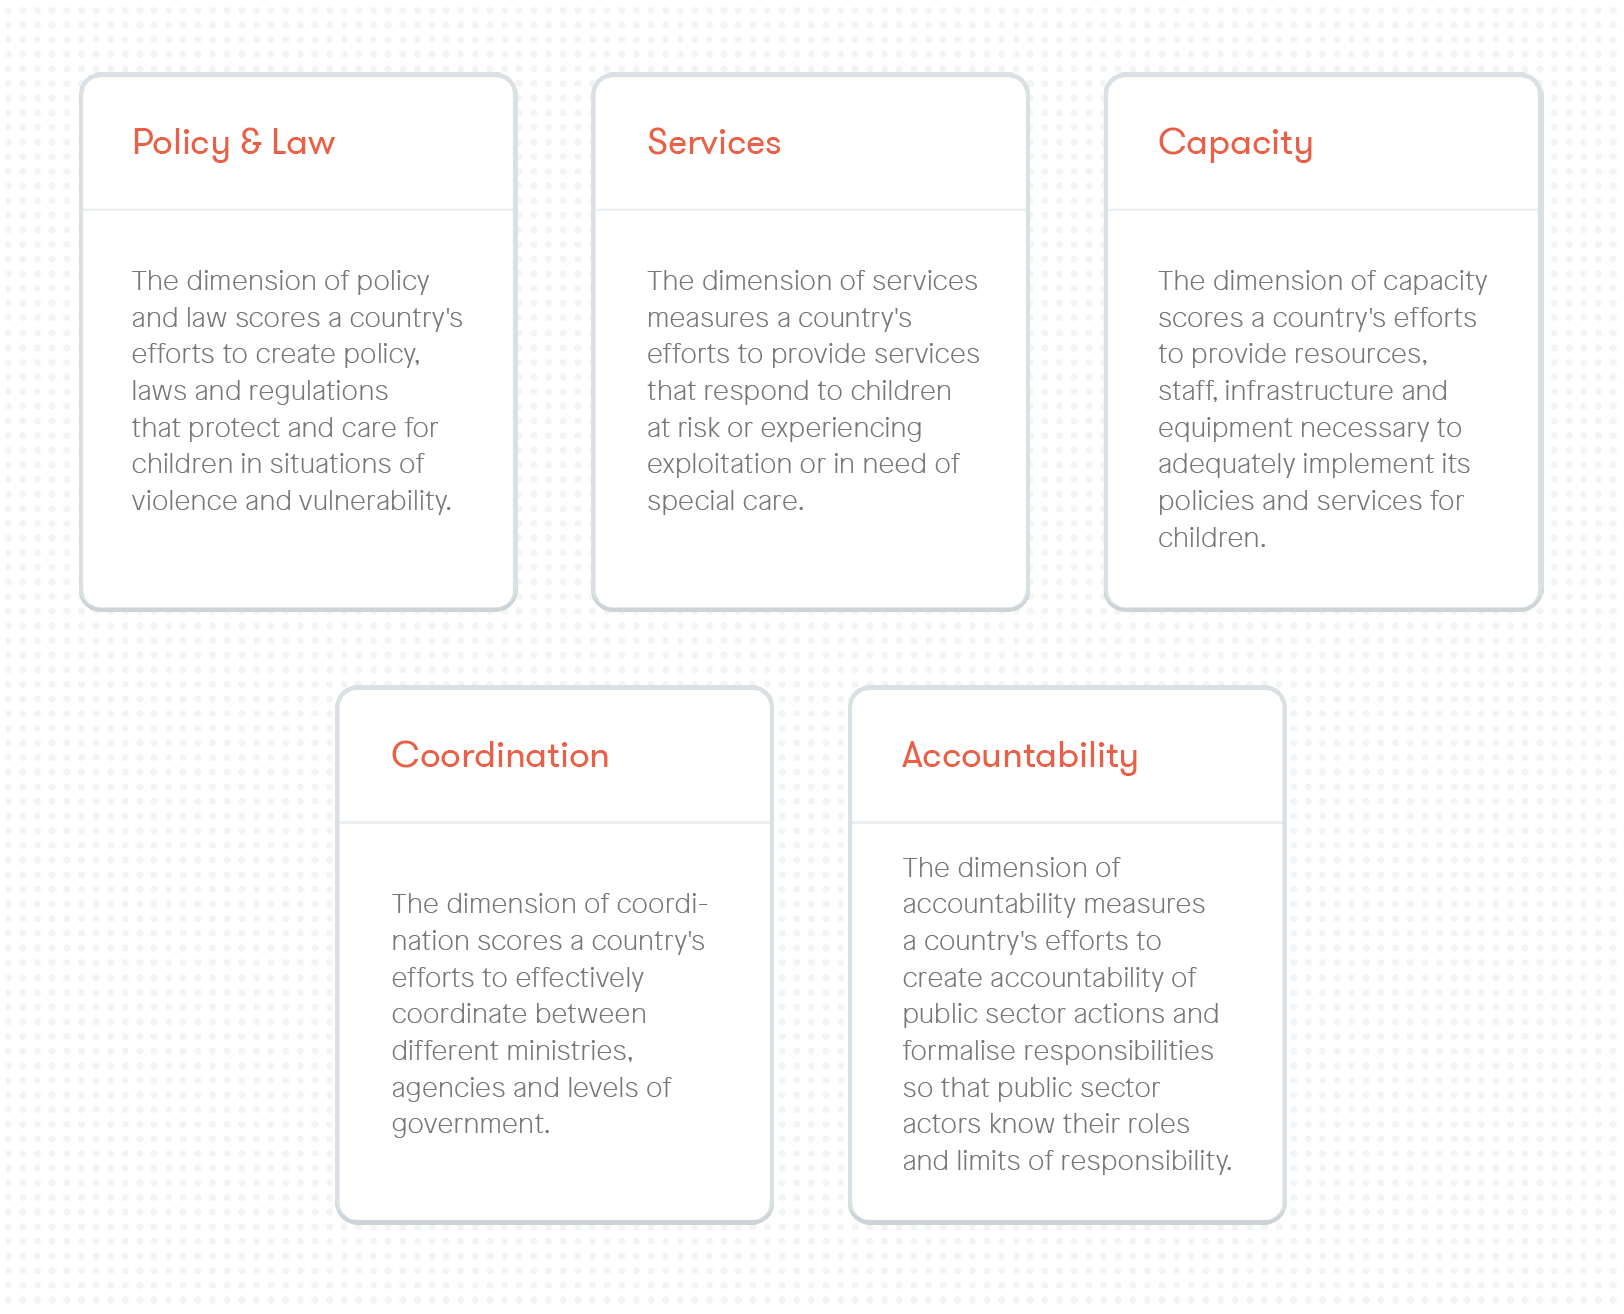
The Index measures five dimensions of government action for each of the articles of the UNCRC that refer to child protection. These five dimensions are: policy and law, services, capacity, coordination and accountability.
Data Collection & Validation
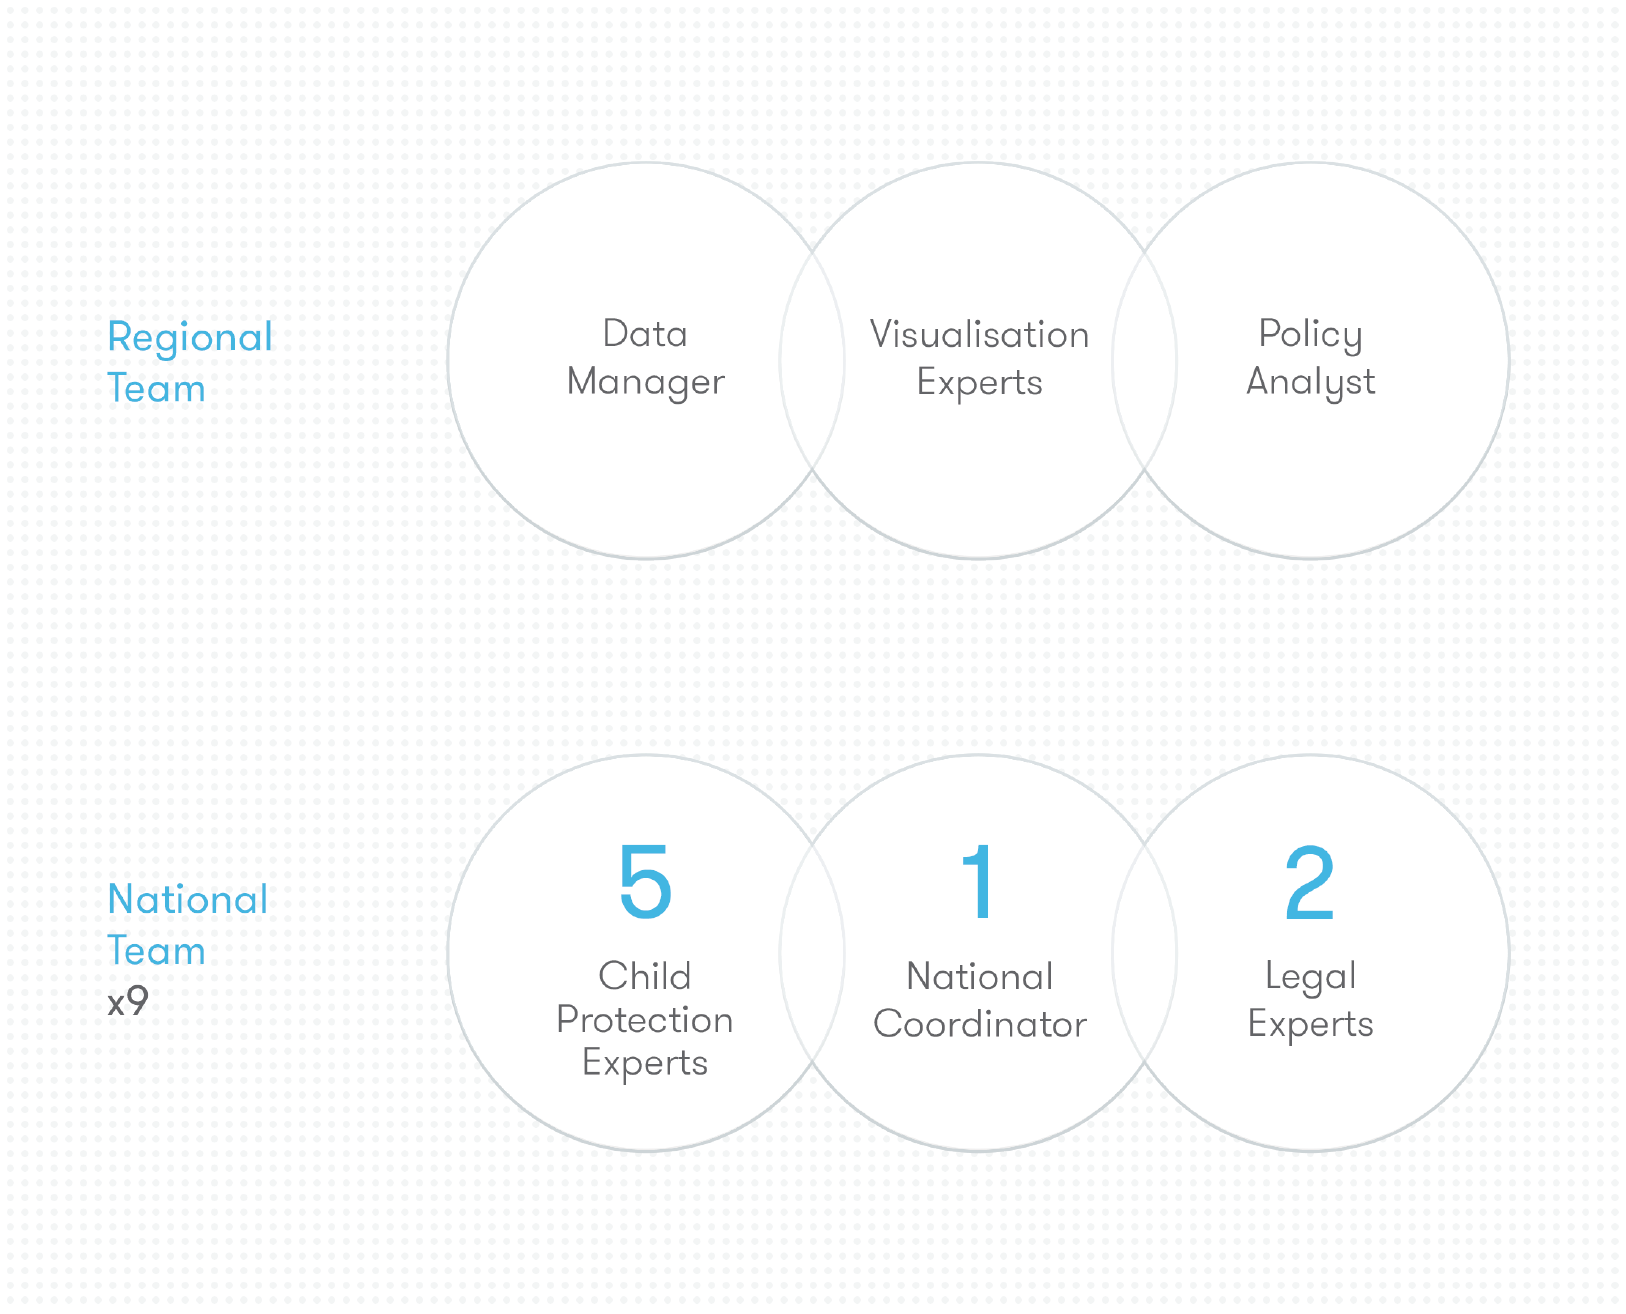
The data collection team included eight child protection experts per country. A training workshop led by the Index Data Manager (and co-author of the Index framework) provided training to the team prior to collection. In the first stage of collection, groups of two experts collected data independently on one of four sections of indicators (using reports, studies, articles, statistics data, etc.) to validate a “yes”, “no” and “partially-implemented” responses to each Index indicator. In this way, two experts reviewed the same indicator separately. Where such evidence-based information was not available, interviews with relevant stakeholders and information based on the personal experience of professionals with relevant expertise in that particular field were taken into account.
After the completion of individual review and validation, responses provided for the same indicator by two different experts were considered and compared side-by-side by the Index Data Manager. Responses found to be inconsistent between the two experts or that lacked sufficient validation required further review and evidence gathering. The two experts assigned to the same indicator again in group work reviewed and discussed the evidence and sought additional information when needed. Joint answers provided by each sub-team were further reviewed by the Index Data Manager.
Three to four reviews over a total period of 3 to 4 months were required for the entire review process, in order to reach final agreements on each indicator considered. A final cross-check of information provided under the various sections of the Index framework was performed by the Index Data Manager before finally validating the National Index, with the support of the National Coordinator and the team of experts.
Scoring
Each qualitative indicator required a “yes,” “no,” or “partially-implemented” answer. To score the results, “yes” = 1, “no” = 0, and “partially-implemented” = 0,5. In situations where several sub-indicators contributed to one main indicator, the final main indicator score is calculated as an average of the scores of its sub-indicators (e.g. 1+0,5+0+1+0,5 = 3 : 5 = 0,6).
For the quantitative indicators, a linear transformation formula was applied: Y = X – Xmin / Xmax – Xmin where Y is the score, X is the quantitative data for the respective country, Xmin is the quantitative data of the least performing country, and Xmax is the quantitative data for the strongest performing country. An average score was calculated for three of the four sources of indicators 1) Current Child Protection
Status of Girls and Boys, 2) Governance Environment and 3) Social Work. In the case of the main source (UNCRC Articles analysed with the Child Protection Systems Approach), each UNCRC article and its indicators is scored separately (to create one average score per article) and equally contributes to the final Index score. Therefore, the final CPI score for each pilot country is calculated as an average of the three sources and the average scores from each UNCRC article.
Footnotes
- Rate of children separated from their families (per 100,000 population aged 0–17)
- Rate of children with disabilities separated from their families (per 100,000 population aged 0–17)
- Rate of children in residential care (per 100,000 population aged 0–17), at the end of the year
- Rate of children aged 0–2 in residential care (per 100,000 population aged 0–2), at the end of the year
- Percentage of children with disabilities in public residential care (all types of institutions), at the end of the year
- Percentage of children placed in foster care out of the total number of children separated from their families, at the end of the year
- Percentage of children with disabilities placed in foster care out of the total number of children 0–17 placed in foster care, at the end of the year
- Percentage of children placed in kinship/ guardianship care out of the total number of children separated from their families, at the end of the year
- Gross adoption rate (per 100,000 average population aged 0-3)
- Percentage of children with disabilities adopted through domestic adoption out of the total number of children adopted through domestic adoption, at the end of the year
- Percentage of children aged 7–17 adopted through domestic adoption out of the total number of children adopted through domestic adoption, at the end of the year
- Ratio of qualified social workers per 100,000 of the general population
- Ratio of specialized judges specialized to work on addressing children issues (per 100,000 population aged 0–17)
- Total social Protection expenditure as percentage of GDP
- Expenditure on social benefits under Family/Children function as % of total social protection expenditure ↩